Recently I've been getting back into Python as a tool to help me be more efficient in my job by automating tedious data tasks, and for deeper analysis into the many datasets we use in Geology, and more recently for me, Finance.
'Why Python?' Python is a free, open source programming language which is used by many in industry and academia for all disciplines. It's relatively easy to learn, and due to the many 'libraries' which have been developed, easily adaptable to many tasks. Additionally, certain software we use in Geology, such as ArcGIS, have Python interfaces allowing high grade commercial software to be incorporated into Python scripts.
As an example of Python's use in this regard, instead of downloading a land tenure file from a government website, unzipping it, importing it into ArcGIS, performing some operations and finally outputting a map; the entire task can be automated in Python and set on a regular schedule, allowing geologists to focus on, well, geology. This also goes for repetitive tasks such as compiling spreadsheets and cleaning up data. What about for data analysis and finance? I will show below how easy it can be to analyze large datasets and create quick, representative charts without having to fuss around in Excel.
OK, so you're ready so start using Python! To be honest, despite the many, many tutorials on the internet, I did not find one that was quite easy enough to use for my purposes. In this post I will give you a few of the key resources I believe will greatly help you get started.
Getting set up with Python, Anaconda, and Spyder
Python on its own, is very bare bones. Think of it like a basic single speed bike. It gets you where you're going, but you might struggle on the hills. Conveniently, just like bikes, people have developed many customizations (gears, knobby tires, and shocks, to keep with the analogy) which allow you to quickly and easily take on many different tasks. For science, and also with finance, you will want to use a dedicated environment designed for these tasks to get you a quick start. Here's a little teaser at what this environment might look like for you:

Screen grab of my Spyder workspace. The left hand side shows the complete script, with windows displaying variables and their values, data tables, interactive help, and in the bottom right corner, the IPython console, where graphs and outputs from operations are displayed.
There are a lot of great tutorials (such as this and this) out there, however I still found getting started to be somewhat confusing, so let me tell you what I think is the best way to go:
- Download and install Anaconda with Spyder:
Anaconda (documentation) is a complete development environment for Python aimed at scientists, and installs over 700 packages which will be crucial to your work, such as iPython (Jupyter), scipy, pandas, numpy, and others. Since they are all installed together, you can expect the full package to Additionally, it comes with Spyder (documentation) , which is a pretty solid 'notebook' style interface to organize your programming.
Previously to Spyder, I was using PyZo another graphical environment aimed at MatLab users. I still like it, however find that a lot of the packages had big dependency problems I couldn't get around - so I switched to Spyder which seems better supported and more configurable.
- Open up Spyder and start coding!
Generally, the documentation for python and the majority of python libraries is pretty thorough, however I found the approach and tutorials from these books to be very helpful as I was getting started:
- Foundations for Analytics with Python (O'Reilly)
This book is aimed at a user familiar with excel, and walks the reader through the basics of data analysis. - Python for Finance (Packt)
The reader of this book should have some background in finance, but it takes the reader through developing various programs useful for finance such as pricing european options, and downloading data. - Learning Pandas (Packt)
Pandas is a very important tool for working with large datasets. While the official Pandas documentation is quite good, this book also introduces the theory of how to approach various data tasks, which I found very useful. - Brandon Rhodes - Pandas from the Ground Up, PyCon 2015 (youtube)
A good short course focusing on Pandas and Anaconda, with additional course materials hosted on github. - Al Sweigart - Automate the Boring Stuff (ebook, book, and youtube)
Another good beginer's resource on Python, with a focus on clever ways to automate day-to-day tasks at work and at home.
In addition to these resources, be aware that the community on StackOverflow, and the official Python and Pandas documentation are all extremely valuable in helping you get started.
Although Anaconda installs many required packages for you, you may need to download and install some special libraries for your particular work or study. This can be as easy as typing "pip install somepackage" or "conda install somepackage" into the command line. Note: you cannot execute these commands from within Spyder, but must use the 'anaconda prompt'. In both cases, the pip/conda helpers will look at the official repositories for the python libraries you need, and will download and install the packages automatically. Easy!
So, what can you do with this? Here's a quick little script I did this morning. Currently I'm studying for the CFA While the various resources we have available can greatly improve our understanding of the concepts, sometimes it helps to dive a little deeper.
In this script, I wanted to investigate the relationship between two statistical estimations of data variance, the Mean Absolute Deviation and Standard Deviation. I was able to break the script in to 3 basic parts and execute it:
1. import a data table using Pandas;
2. define the Mean Absolute Deviation as a function. (Standard Deviation is built in to Python's Statistics package.); and
3. Write the calculated values to the table, and then graph them.
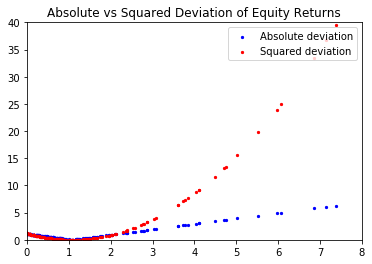
Here's the result:
You can download this simple code and the data here.